
It’s that time of the year, when most of us responsible for sales, are reflecting on numbers and quotas. These are the big line numbers, easy to identify with, whether you made your quota, or not. But as you’re pondering about what the new sales quota will be for the coming year, don’t forget about all those other numbers that show progress throughout the year. These are your metrics that built up those final numbers.
Lead generators and sales departments: be sure to study the metrics that made for your spectacular year! And if it wasn’t all good news, then you have even more reason to use visualization with your numbers to plan for next year. Don’t worry, I know not everyone is using a sophisticated tool to spread those numbers out into graphs and charts, but fear not. You can easily accomplish the same thing using Excel. You just need to collect data.
Here are some of the components and metrics that will help you see how you got where you are:
LEADS:
You want to keep track of who you spoke with throughout the year, and keep notes as to where the leads came from. (i.e., referred by colleagues, from your support team, repeat business, etc.)

Leads Month by Month
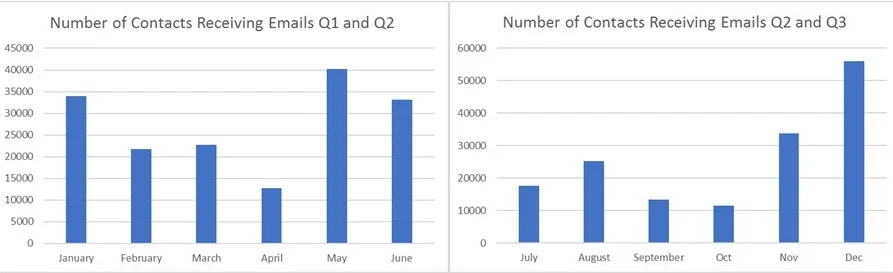
Next, you need to know the numbers of emails and email campaigns that were sent, so that you can see the outbound marketing activity accounting for the day-to-day lead generation efforts. See below:
EMAILS
High numbers are needed to see a return on your investment in this area. So, ensure your database is large, clean, and relative to your message. Also, be sure to watch the clicks resulting from the links you place in your email that record who is reading, and going to your website, as a result of the email campaign.
Lastly, you want to analyze the email outreach by territory, or region. The type of chart to reflect this is found below: (You should also do this with outbound phone calls.)
CONTACTS
You want to be sure you have enough mailers going out for the territories/regions you are covering. This is also a good way to know if your team is consistently covering all sales areas.

Numbers are important when you are in sales. If you aren’t already doing some basic metrics, make it a commitment to start doing so in the coming year. Keep an eye on this, as well as on the challenges coming up that we addressed in our blog last week. All of these tips should set you up on solid ground for the year ahead. Remember, you don’t need fancy tools to watch your numbers, just collect the data, and get comfortable with it. The picture from your charts will tell you the story. Happy lead generating and success with your upcoming sales!
(If you’re interested in an amazing Business Development Information System that will get you on the right track, look here: https://www.sales-link.net/bdi or contact us for a demo: https://www.sales-link.net/contact-1 )